

PREVIEW ARTICLE
Excerpts from ABSTRACT, INTRO, & PART IV
Abstract
The Created Heterozygosity and Natural Processes (CHNP) model, proposed by Nathaniel Jeanson (Jeanson, 2016), suggests that a significant amount of genetic diversity in originally created organisms was frontloaded rather than accumulating slowly through random mutations. Implicit in Jeanson’s model is the postulate that all diversity in humankind has emerged from two biallelic individuals. Little work has been done to explicate original allelic morphologies in created kinds, therefore this study will address this gap in the CHNP model by identifying functional genes (the frontloaded heterozygosity) and their deleterious variants. This study also aims to give quantified rates of mutations necessary for novel allelic frequencies. Doing so allowed for testing the two primary predictions of the CHNP model: (1) Mutations accumulate at a semi-constant rate, and are sufficient to explain novel diversity beyond the initial biallelic kinds and (2) initial created kinds were highly functional and optimized, containing no non-functional or suboptimal gene variants, therefore only function will be shared across lineages. We analyzed a variety of gene families (including CLLU1, MHC, LCT, ABO, Rh, KIR, NANOG, AMY1, DARC, GULO, and FOXP2) and found that initial functional alleles are highly conserved across species, while loss-of-function alleles are species-specific. Balancing selection reveals conflicting and contradictory hypotheses for the origin of alleles leading to the evolutionary explanations becoming ad hoc. The observed mutation rates for diversification of original biallelic pairs falls in the estimated 6000-year timeframe. These findings dovetail with prior CHNP research for known modern rates of molecular clock data (Jeanson, 2019). The results of this data are best explained by the CHNP model, as these genes produce young, discontinuous phylogenetic trees which begin with two variants and later branch into homozygosity. The data strongly supports genetic drift, founder effects, and weak selective pressure for all gene families.
Introduction
The key tenets of CHNP are frontloaded genetic diversity followed by rapid diversification into more homozygous populations via recombination, genetic drift, and regulatory mechanisms all amplified by major and minor founder effects. In CHNP, mutations are seen as creating new allelic variation by degrading the optimized biallelic state in various ways. CHNP, therefore, follows the principles of genetic entropy (GE) and chemical laws (Sanford, 2008). The selected gene families support this view as well as known chemical and structural mutation hot spots. The assumption of design is taken for granted in this paper, however much research has been done to support this inference and the problem of the insufficiency of naturalistic processes (Axe, 2004; Meyer, 2004; Meyer, 2021; Nelson & Buggs, 2016; Thorvaldsen & Hössjer, 2020). CHNP provides a coherent alternative framework to explain the abundance of genotypic and phenotypic diversity we observe in the biological world by emphasizing a pre-existing, divinely-created potential for variation, which is then expressed and refined through natural processes over a much shorter timeframe than mainstream evolutionary models propose.
Being a relatively new evolutionary framework (a little over a decade old), CHNP has yet to elucidate particular historical details such as the evolution of the diversity of alleles. This has led to some popular-level critiques from well-meaning skeptics of the model making serious errors in their assessments (Duff, 2023; Hancock, 2023). Questions have been raised along the lines of: (1) How does CHNP account for the wide diversity and sheer number of alleles in modern human populations, when Adam and Eve could only account for a maximum of four alleles? (2) How does a human population maintain this initial variation of a biallelic couple over generations and then increase in variation? This paper successfully accounts for both challenges: There is overwhelming evidence that all the diversity at different loci for human alleles can be explained by two original humans with the same bi-allelic autosomes. The disparity (divergence in morphospace) and diversity (increase in morphologies) is then created by both homologous recombination and mutational load/GE, respectively.
Works Cited
Axe, Douglas D. “Estimating the Prevalence of Protein Sequences Adopting Functional Enzyme Folds.” Journal of Molecular Biology, vol. 341, no. 5, Aug. 2004, pp. 1295–1315, https://doi.org/10.1016/j.jmb.2004.06.058.
Duff, Joel. “Does Created/Designed Heterozygosity Make Sense? Reacting to Drs. Hancock and Jeanson.” YouTube, 23 Aug. 2023. https://www.youtube.com/watch?v=M_ZQ0jpkeE0.
Hancock, Zach B. “Designed Diversity Is Nonsense.” YouTube, 21 Aug. 2023. https://www.youtube.com/watch?v=jDo3FRMFCW0.
Jeanson, Nathaniel. “Origin of Human Mitochondrial DNA Differences.” Answers Research Journal, vol. 9, p 123–130, Apr. 27, 2016. https://answersresearchjournal.org/origin-human-mitochondrial-dna-differences/.
Jeanson, Nathaniel. “Testing Predictions for a Human Y Chromosome Molecular Clock.” Answers Research Journal, vol. 12, p 405–423, 4 Dec. 2019. https://answersresearchjournal.org/human-y-chromosome-molecular-clock/.
Meyer, Stephen C. “The Origin of Biological Information and the Higher Taxonomic Categories.” Proceedings of the Biological Society of Washington, vol. 117, no. 2, 4 Aug. 2004, pp. 213–239. https://www.discovery.org/a/2177/.
Meyer, Stephen C. “The Return of the God Hypothesis: Compelling Scientific Evidence for the Existence of God.” HarperOne, 30 Mar. 2021.
Nelson, Paul A., and Richard J. A. Buggs. “Next Generation Apomorphy: The Ubiquity of Taxonomically Restricted Genes.” Next Generation Systematics, by Paul A. Nelson and Richard J. A. Buggs, Cambridge University Press, 5 June 2016, pp. 237–263. 10.1017/CBO9781139236355.013.
Sanford, John C. “Genetic Entropy & the Mystery of the Genome.” FMS Publications, 2008.
Thorvaldsen, Steinar, & Ola Hössjer. “Using Statistical Methods to Model the Fine-Tuning of Molecular Machines and Systems.” Journal of Theoretical Biology, vol. 501, no. 110352, Sept. 2020, https://doi.org/10.1016/j.jtbi.2020.110352.
Part IV: ABO
The ABO blood group, the first human blood group system discovered, remains a cornerstone of evolutionary biology and anthropology. The standard evolutionary model seeks to explain the persistence of the A, B, and O alleles in human and other primate populations through a concept known as “trans-species polymorphism.” This hypothesis posits that certain alleles are maintained by balancing selection for millions of years, predating speciation events. Consequently, the functional A and B alleles are argued to be approximately 20 million years old, having originated in a common ancestor and been preserved through the evolutionary divergence of modern primate branches (Ségurel et al., 2012). This ancient origin is believed to be the reason why humans, chimpanzees, gorillas, and other primates and mammals share the same genetic basis for the A and B antigens. Some mammals, such as cows, dogs, and cats, which are said to have diverged from the primate line over 80-90 million years ago, still maintain functional A and B alleles which are said to have been convergently evolved.
1. The Paradox of the ‘O’ Allele
While the A and B alleles are functional—coding for glycosyltransferase enzymes that attach specific sugars to red blood cells—the O allele is non-functional, or “null.” The O phenotype arises from mutations, typically single nucleotide polymorphisms (SNPs) or insertions/deletions (InDels), that introduce a frameshift, resulting in a non-working enzyme. From a molecular perspective, the mutational pathways to a null allele are numerous and common; it is far easier to break a functional gene than to create one.
This molecular reality is coupled with a powerful selective pressure: the O allele confers significant resistance to severe forms of malaria. Given that malaria is a potent selective force in many regions of the world, and that primates have purportedly been evolving in such environments for millions of years, a paradox emerges. If the functional A and B alleles were maintained for 20 million years, then the highly advantageous and mutationally accessible O allele should have appeared constantly throughout this timeframe. Natural selection should have preserved it just as diligently, if not more so, than A and B. The logical prediction of the evolutionary model is, therefore, that the O allele should also be ancient and shared by descent among primate species.
2. Genetic Evidence Falsifies this Evolutionary Prediction
Contrary to the prediction derived from the deep-time model, genetic data reveals the precise opposite. While the functional A and B alleles show evidence of shared ancestry, the non-functional O alleles are demonstrably recent and species-specific. A key study by Ségurel et al. (2012) states this finding unequivocally:
“Thus, primates not only share their ABO blood group, but also the same genetic basis for the A/B polymorphism. O alleles, in contrast, result from loss-of-function alleles such as frame-shift mutations and appear to be species specific.”
Another paper researching non-primate ABO polymorphisms, from Kermarrec et al. (2017), wrote:
“The sequences of cDNAs corresponding to the chimpanzee and rhesus monkey O alleles were characterized from exon 1 to 7 and from exon 4 to 7, respectively. A comparison of our results with ABO gene sequences already published by others demonstrates that human and non-human primate O alleles are species-specific and result from independent silencing mutations. These observations reinforce the hypothesis that the maintenance of the ABO gene polymorphism in primates reflects convergent evolution more than transpecies inheritance of ancestor alleles.”
This means the specific mutations that create the O allele in humans are different from the mutations that create the O allele in chimpanzees, which are different from those in bonobos, orangutans, gorillas, etc. This is definitive proof that the O allele is not shared from a common ancestor. Instead, its appearance is convergent, having arisen independently in each lineage. The central question remains: if the O allele is so advantageous and easy to make, why did it not appear and become fixed or conserved anciently?
Evolutionary genetics has proposed several auxiliary hypotheses to resolve this paradox, none of which withstand scrutiny:
The Pathogen Trade-Off Hypothesis:
One proposal is that the O allele was constantly eliminated by negative selection because it confers vulnerability to other pathogens, such as gut bacteria like Vibrio cholerae. However, this is empirically falsified by the existence of entire populations, such as Native Americans, who are nearly 100% Type O and thrived for millennia prior to European contact. This demonstrates that any disadvantage cannot be a universal evolutionary law sufficient to prevent the fixation or preservation of the O allele over tens of millions of years.
The Malaria-Smallpox “Tug-of-War” Hypothesis:
A more complex hypothesis has been invoked to explain the balanced allele frequencies in Europeans, where malaria was endemic but did not seem to exert the same selective pressure. This model suggests a selective “tug-of-war,” with malaria selecting against A and B, while smallpox targeting the foundational H-antigen (most exposed in Type O individuals), thereby selecting for A and B. However, the link between smallpox and blood type is based on conflicting and weak evidence. The foundational studies from the 1960s were heavily criticized by peers as likely reflecting methodological artifacts, while other comprehensive studies found no statistically significant link at all (Downie et al., 1965). Furthermore, genetic analysis of ancient European populations shows the O allele was present prior to widespread agriculture and malaria pressure, and its distribution shows no clear correlation with ancient malaria patterns (Gelabert et al., 2017). Given the challenges and apparent ad hoc nature of these explanations, it is valuable to consider an alternative framework that may account for the data more directly.
3. Phylogenetic Structure and Mutation Counts in ABO
The ABO system’s 345 recognized alleles (ISBT v11, January 2026) form a tree-like phylogeny rooted in an ancestral A-like sequence, with major branches forking via defining core events and subtypes adding derivatives. This structure collapses observed diversity into ~150–200 unique nucleotide changes (mostly SNPs and indels), far fewer than independent origins would require. Functional A and B alleles are conserved across species, while loss-of-function O variants are species-specific, supporting CHNP’s frontloaded heterozygosity.
Table 1: Cumulative Missense Mutations by ABO Phenotype
The table below summarizes missense mutations (amino acid-altering changes) across 207 alleles from a detailed dataset, grouped by phenotype. These represent cumulative instances relative to reference A¹ (ABO*A1.01).
| Phenotype Group | # of Alleles | Total Missense Mutations | Avg Mutations per Allele |
| A Subtypes | |||
| A1 (Reference) | 2 | 1 | 0.5 |
| A2 | 18 | 32 | 1.8 |
| A3 | 7 | 10 | 1.4 |
| A (Weak/Other)* | 55 | 83 | 1.5 |
| B Subtypes | |||
| B (Core) | 3 | 14 | 4.7 |
| B (Weak/Other)** | 46 | 230 | 5.0 |
| O Subtypes | |||
| O (Null) | 62 | 130 | 2.1 |
| Hybrids | |||
| cis-AB / B(A) | 12 | 42 | 3.5 |
| TOTAL | 207 | 544 | 2.6 |
Note: *Includes Aweak, Ael, Afinn, Am, Ax. **Includes B3, Bel, Bweak, Bx. The low average divergence (2.6 mutations) across hundreds of alleles supports the CHNP view of recent diversification from highly functional progenitors, rather than deep-time accumulation.
Table 2: Cumulative Missense Mutations by ABO Phenotype
Analysis of 207 detailed alleles showing the distribution of amino acid-altering changes relative to the reference A1 allele.
| Branch / Clade | Allele Count (Est.) | Core Mutation Events (Defining the Branch) | Derivative Diversity (Unique Events) | Representative Subtypes | Evolutionary Mechanism |
| A (Ancestral) | ~60 | 0 (Reference State) | ~40 | A¹, A², A³ | Original State: Variations arise via single SNPs (e.g., p.Pro156Leu). |
| B (Divergent) | ~100 | 7 (nt substitutions) | ~30 | B, B³, Bʷ | Frontloaded Variant: Core differences (c.526C>G, etc.) likely created; tips show degradation. |
| O (Null) | ~150 | 1 (c.261delG Frameshift) | ~20 | O¹, O², O³ | Loss of Function: Dominant inactivation event followed by drift/selection (Malaria). |
| Hybrids | ~35 | Chimeric Fusions | ~10 | cis-AB, B(A) | Recombination: Fusion of A/B cores; not de novo creation of new information. |
| OVERALL | 345 | ~10 Core Events | ~100–150 | Parsimony: <200 unique events explain all 345 alleles. |
The “Bushy” structure of the tree—short branches radiating from specific cores—aligns with the “Pulse-Fragmentation” model below. The high allele count is an illusion caused by counting slight variants of the same few functional themes.
Table 3: ABO Phylogenetic Tree
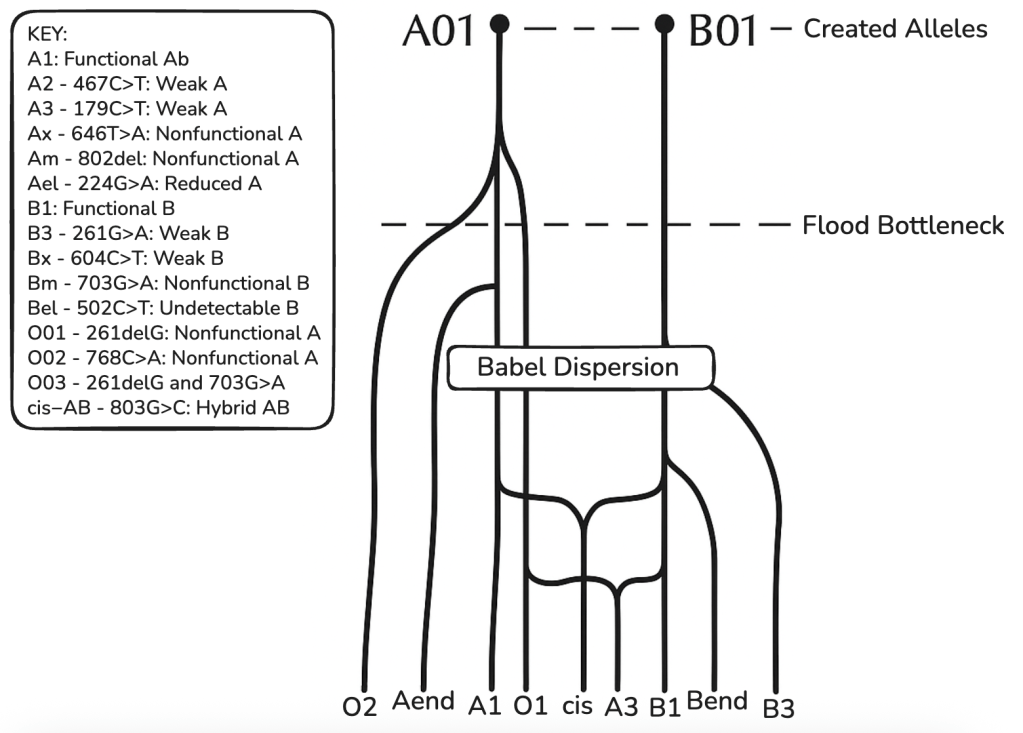
Above is a phylogenetic tree for the ABO blood group gene based on the CHNP model. Showing several mainline alleles as well as two case bases (cis-AB and A3) which arose from, among other events, intragenic recombination. A-end and B-end represent further variants of weak A or B and O alleles.
This model shows alleles cluster into 6–8 major clades with low divergence (avg. 1.5 nt/allele beyond cores), consistent with young, discontinuous trees.
4. Implications for the CHNP Model
Mutation Budget
To evaluate whether the observed diversity in the ABO gene is consistent with the CHNP model (a ~6,000–10,000 year timeframe), we must calculate the expected number of mutation events using established human mutation rates. The ABO gene spans approximately 24,000 base pairs (24kb). The standard human mutation rate is estimated at 1.1 X 10⁻⁸ per base pair per generation (Roach et al., 2010; Campbell et al., 2012).
Traditionally, we analyze this “budget” like so. The number of mutations separating a modern individual from the original ancestor, Lineage Accumulation. In a single direct lineage from a founder (e.g., Adam) to a modern human, the expected number of de novo mutations in the ABO gene is calculated as:
Mutations = Rate (1.1 x 10⁻⁸) x Gene Size (24,000) x Generations (low 200 to high 333)
(1.1 x 10-8) x 24,000 x 333 (or 200) ≈ 0.087912 mutations (or 0.528)
A modern individual is expected to differ from the ancestral sequence by less than 0.1 mutations on average.
This indicates that the 127–200 unique variants observed today cannot be the result of accumulation along a single line. They must represent a collection of rare variants preserved from a much larger total inventory of events across the population.
While a single lineage accumulates little change, the population as a whole generates massive diversity due to exponential growth. Modeling a population expansion from a bottleneck of 6 individuals to 8 billion over 333 generations, we can estimate the total number of mutation events that have occurred in the ABO gene history. The total human mutations (genome-wide) are ~4.40 x 10¹¹ (440 Billion) events.
The ABO gene represents ~0.0008% of the genome. For ABO specific events, we calculate 4.40 x 1011 x (24,000 / 3.2 x 10⁹) = 3.3 million events. Therefore, the CHNP model faces a “retention” challenge rather than a “production” challenge. The young human population has generated over 3.3 million mutation events in the ABO gene history, far exceeding the ~200 unique alleles observed today. The vast majority of these 3.3 million events were lost to genetic drift or purifying selection (ABO incompatibility). The presence of ~200 unique alleles is mathematically possible within 6,000 years, provided that these specific variants survived drift.
The observation that most alleles are “subtypes” of A or B (differing by only 1 SNP) is consistent with them being recent survivors from this large pool of 3.3 million historical events. The ABO locus’s genetic diversity—345 alleles arising from ~127–200 unique mutations—must be understood in the context of population-wide mutation loads. While a single lineage accumulates negligible change (<1 mutation), the global human population has generated an estimated 3.3 million mutation events in the ABO locus over the last 10 millennia. The observed ~200 unique variants represent a tiny fraction (<0.01%) of this historical inventory that successfully reached detectable frequencies. This supports a model where the core A and B alleles were frontloaded, while the “bushy” diversity of subtypes (including the various O alleles) arose recently from the vast reservoir of population-wide mutations.
Paternal Age Effect
Standard evolutionary calculations assume a constant mutation rate based on a 20-to-30-year generation time. However, the CHNP model posits distinct biological parameters for the early human population, specifically the extreme longevity of the Patriarchs (e.g., Noah, Shem, Arphaxad). Modern genetic research confirms a strong Paternal Age Effect, where the number of de novo mutations passed to offspring increases exponentially with the father’s age due to continuous cell division in the male germline (Kong et al., 2012).
For example, a 30-year-old father transmits ~45 new mutations. Whereas, if the mutation rate doubles every ~16.5 years of paternal age (as observed in modern humans), a father conceiving at age 100, 200, or 500 would transmit hundreds or potentially thousands of de novo mutations in a single generation.
Table 4: Patriarch Exponential Mutation Curve
| Father’s Age at Conception | Standard Model (Total Mutations Transmitted In X Years) | Patriarchal Model (Projected Mutations)* | Impact Factor |
| 30 years (Modern Avg) | ~45 | ~45 | 1x (Baseline) |
| 63 years | ~90 (gen 2) | ~180 | 2x |
| 100 years | ~135 (gen 3) | ~850 | ~6x |
| 200 years | ~270 (gen 6) | ~56,000** | ~207x |
| 500 years (e.g., Noah) | ~720 (gen 16) | Saturation | Explosive |
*Projections based on a doubling of the mutation rate every 16.5 years of paternal age (Kong et al., 2012). **Theoretical projection highlighting the exponential potential of long-lived germlines.
This biological reality suggests that the “Input” of mutations in the first millennium of human history was not linear but explosive. The initial mutation inventory was likely frontloaded by these long-lived progenitors, rapidly diversifying the created template far faster than current low-fidelity rates would predict.
Demographic Accelerants: Inbreeding and Fixation
Following the population bottlenecks (Creation and the Flood), high rates of consanguinity (inbreeding) were unavoidable. While modern population genetics views inbreeding primarily as a mechanism for exposing recessive traits, in the CHNP context, it serves as a powerful evolutionary accelerant in two ways:
- Rapid Fixation via Drift: In small, inbreeding populations, the coefficient of genetic drift is high. New mutations—whether generated by patriarchs or random errors—can move from 0% to 100% frequency (fixation) in just a few generations. This overcomes the “swamping” effect seen in large populations, allowing unique ABO variants (like specific O alleles) to become characteristic of entire distinct lineages instantly.
- Accumulation of Genetic Load: Inbreeding depresses the effectiveness of purifying selection (“Inbreeding Depression”). Slightly deleterious mutations (such as the degradation of the A antigen into O) are less effectively weeded out in small populations (Lynch et al., 1995). This relaxes the selective constraints, allowing loss-of-function alleles to accumulate and persist at rates that would be impossible in a large, randomly mating population.
The Pulse-Fragmentation Model
When these factors are integrated, the CHNP model predicts a specific pattern:
- Pulse: A surge of mutational diversity generated by high-age Patriarchs.
- Fragmentation: Rapid isolation of this diversity into distinct gene pools via inbreeding and migration.
- Degeneration: The inevitable slide from heterozygous function (A/B) to homozygous dysfunction (O) due to entropic forces.
Additional Considerations
- Phylogenetic Tree Structure: ABO’s bushy clades (e.g., weak B from B core + 1–2 missense) exemplify recurrent inheritance, reducing independent events.
- Parsimonious Evolutionary Model: <200 uniques suffice for all diversity, aligning with CHNP’s recent, bottlenecked history.
Conclusion
The ABO locus’s genetic diversity—345 alleles arising from ~127–200 unique mutations—is within the expected mutation budget under the CHNP model (~330 events over 10 kyr). The phylogenetic tree structure, with subtypes branching from a handful of core ancestral mutations (e.g., A-to-B divergence), supports a parsimonious evolutionary framework where recurrent propagation explains observed variation. Pre-loaded A and B alleles could plausibly have diversified via neutral drift in a young human population, consistent with CHNP claims. The observed genetic diversity at the ABO locus, with 127 to 200 unique mutations, is within the expected range of mutations under the CHNP model. This indicates that the pre-loaded A and B strings could have been accumulating mutations for around 10 kyr, consistent with the CHNP claim for ABO.
Works Cited
Besenbacher, Søren, et al. “Novel Variation and de Novo Mutation Rates in Population-Wide de Novo Assembled Danish Trios.” Nature, vol. 6, no. 1, 19 Jan. 2015, https://doi.org/10.1038/ncomms6969.
Dean, Laura. “Hemolytic Disease of the Newborn.” Nih.gov, National Center for Biotechnology Information (US), 2005, www.ncbi.nlm.nih.gov/books/NBK2266/.
*Dean, Laura. “The ABO Blood Group.” National Library of Medicine, National Center for Biotechnology Information (US), 2005, www.ncbi.nlm.nih.gov/books/NBK2267/.
Downie, A W, et al. “Smallpox Frequency and Severity in Relation to A, B and O Blood Groups.” Bulletin of the World Health Organization, vol. 33, no. 5, 1965, p. 623, pmc.ncbi.nlm.nih.gov/articles/PMC2475872/.
Gelabert, Pere, et al. “Malaria Was a Weak Selective Force in Ancient Europeans.” Scientific Reports, vol. 7, no. 1, 3 May 2017, https://doi.org/10.1038/s41598-017-01534-5.
International Society of Blood Transfusion (ISBT). (2026). ABO Allele Nomenclature. Retrieved from https://blooddatabase.isbtweb.org/system/ABO.
Kermarrec, Nathalie, et al. “Comparison of Allele O Sequences of the Human and Non-Human Primate ABO System.” Immunogenetics, vol. 49, no. 6, 5 May 1999, pp. 517–526, https://doi.org/10.1007/s002510050529.
Kong, Augustine, et al. “Rate of de novo mutations and the importance of father’s age to disease risk.” Nature, vol. 488, no. 7412, 2012, pp. 471-475.
Kwiatkowski, Dominic P. “How Malaria Has Affected the Human Genome and What Human Genetics Can Teach Us about Malaria.” The American Journal of Human Genetics, vol. 77, no. 2, Aug. 2005, pp. 171–192, https://doi.org/10.1086/432519.
Lynch, M., et al. “Mutation accumulation and the extinction of small populations.” The American Naturalist, vol. 146, no. 4, 1995, pp. 489-518.
Marian, Jakub. “Blood Type Distribution,” Jakubmarian.com, 2018.
Mullaney, J. M., et al. “Small Insertions and Deletions (INDELs) in Human Genomes.” Human Molecular Genetics, vol. 19, no. R2, 21 Sept. 2010, pp. R131–R136, https://doi.org/10.1093/hmg/ddq400.
Nachman, Michael W, and Susan L Crowell. “Estimate of the Mutation Rate per Nucleotide in Humans.” Genetics, vol. 156, no. 1, 1 Sept. 2000, pp. 297–304, https://doi.org/10.1093/genetics/156.1.297.
O’Neil, Dennis. “Modern Human Variation: Distribution of Blood Types.” Kinsta.page, 2012, anthropology-tutorials-nggs7.kinsta.page/vary/vary_3.htm.
Ségurel, Laure, et al. “The ABO Blood Group Is a Trans-Species Polymorphism in Primates.” Proceedings of the National Academy of Sciences, vol. 109, no. 45, 6 Nov. 2012, pp. 18493–18498, www.pnas.org/content/109/45/18493, https://doi.org/10.1073/pnas.1210603109.
Wang, Jianbin, et al. “Genome-Wide Single-Cell Analysis of Recombination Activity and de Novo Mutation Rates in Human Sperm.” Cell, vol. 150, no. 2, 13 June 2012, pp. 402–412, https://doi.org/10.1016/j.cell.2012.06.030.Yamamoto, F., et al. “Molecular Genetic Basis of the Histo-Blood Group ABO System.” Nature, vol. 345, no. 6272, 17 May 1990, pp. 229–233, http://www.ncbi.nlm.nih.gov/pubmed/2333095, https://doi.org/10.1038/345229a0.

Leave a comment